Case study 02 · SaaS
Steller
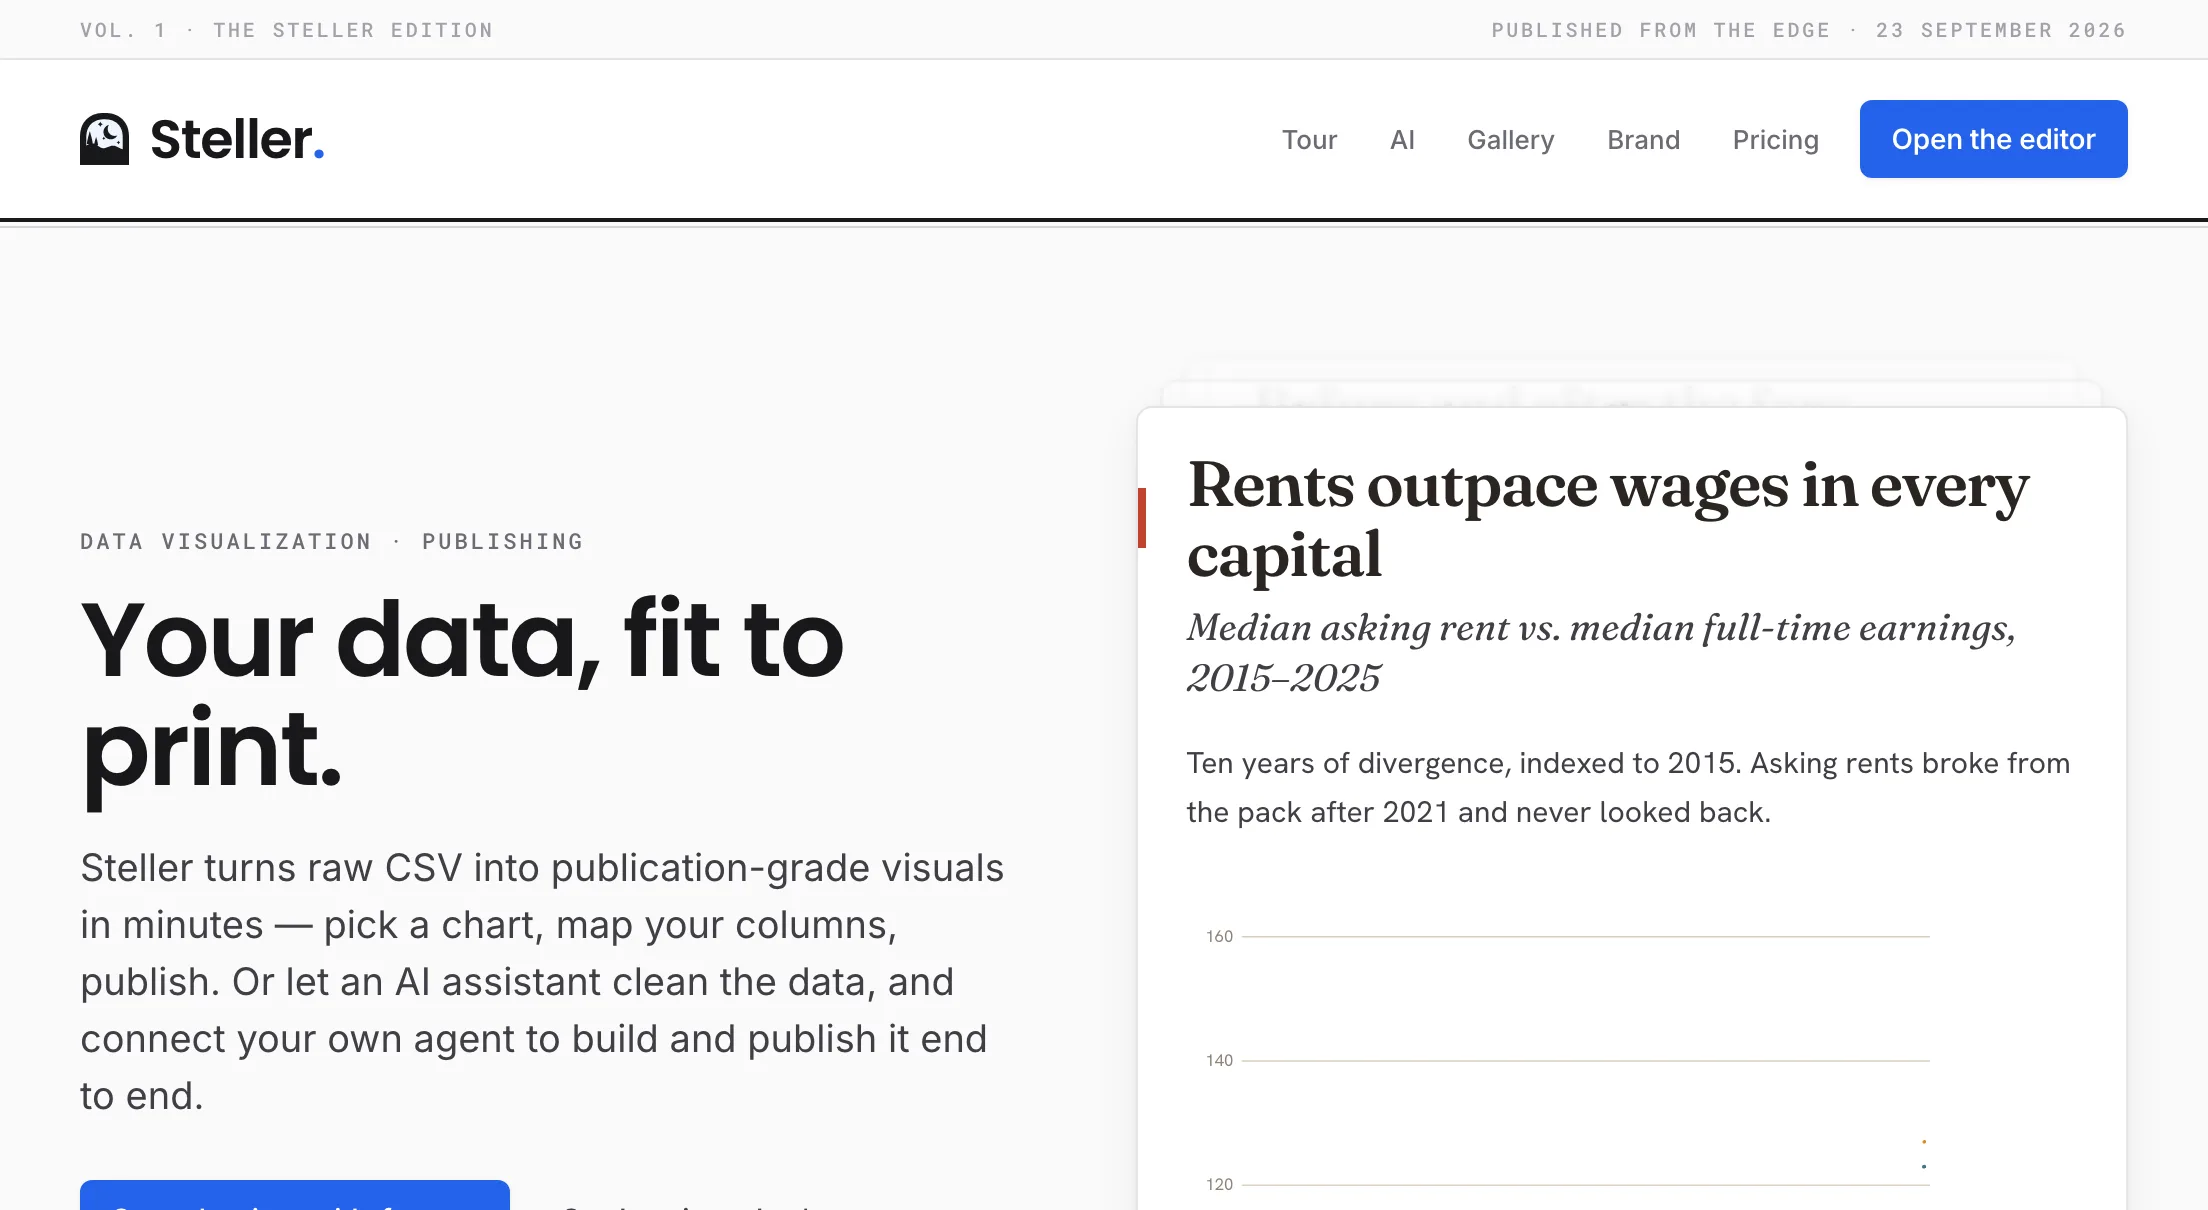
Turn a spreadsheet into a publication-grade chart, then share or embed it.
steller.my ↗- Role
- Design, build and operations
- Team
- IRFANCODER in-house team
- Timeline
- ~2 months · launched September 2026
- Stack
- TypeScript · React · Vega · Cloudflare Workers
01 / The problem
Researchers, writers and teams with a spreadsheet want charts that look fit to publish. Most tools make them choose between bland defaults and learning a charting language.
02 / The contribution
We designed and built the whole product: 26 chart types across 7 families, a live editor with an editable spreadsheet beside the chart, an AI data assistant that previews each change before applying it, and one-click publishing to a shareable page, a responsive embed or an image. One Cloudflare Worker serves both the API and the app, and the same chart builders render the preview and the published page, so what you see is what gets published.
03 / The result
Steller launched in September 2026 with Malaysian open-data sources built in, putting a publication-ready chart minutes away from a CSV.
Steller is an IRFANCODER ENTERPRISE product: we designed, built and run it ourselves.